Trend Reports (Advanced)
Trend Reports (Advanced)
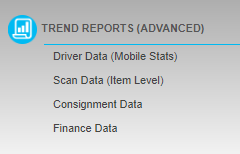
Under the Reports menu in TransVirtual there are 4 different pages that provide useful reporting data:
This article will detail what each page does and can be used for.
This article will detail what each page does and can be used for.
Driver Data (Mobile Stats)
This page in TransVirtual is used to show driver activity:
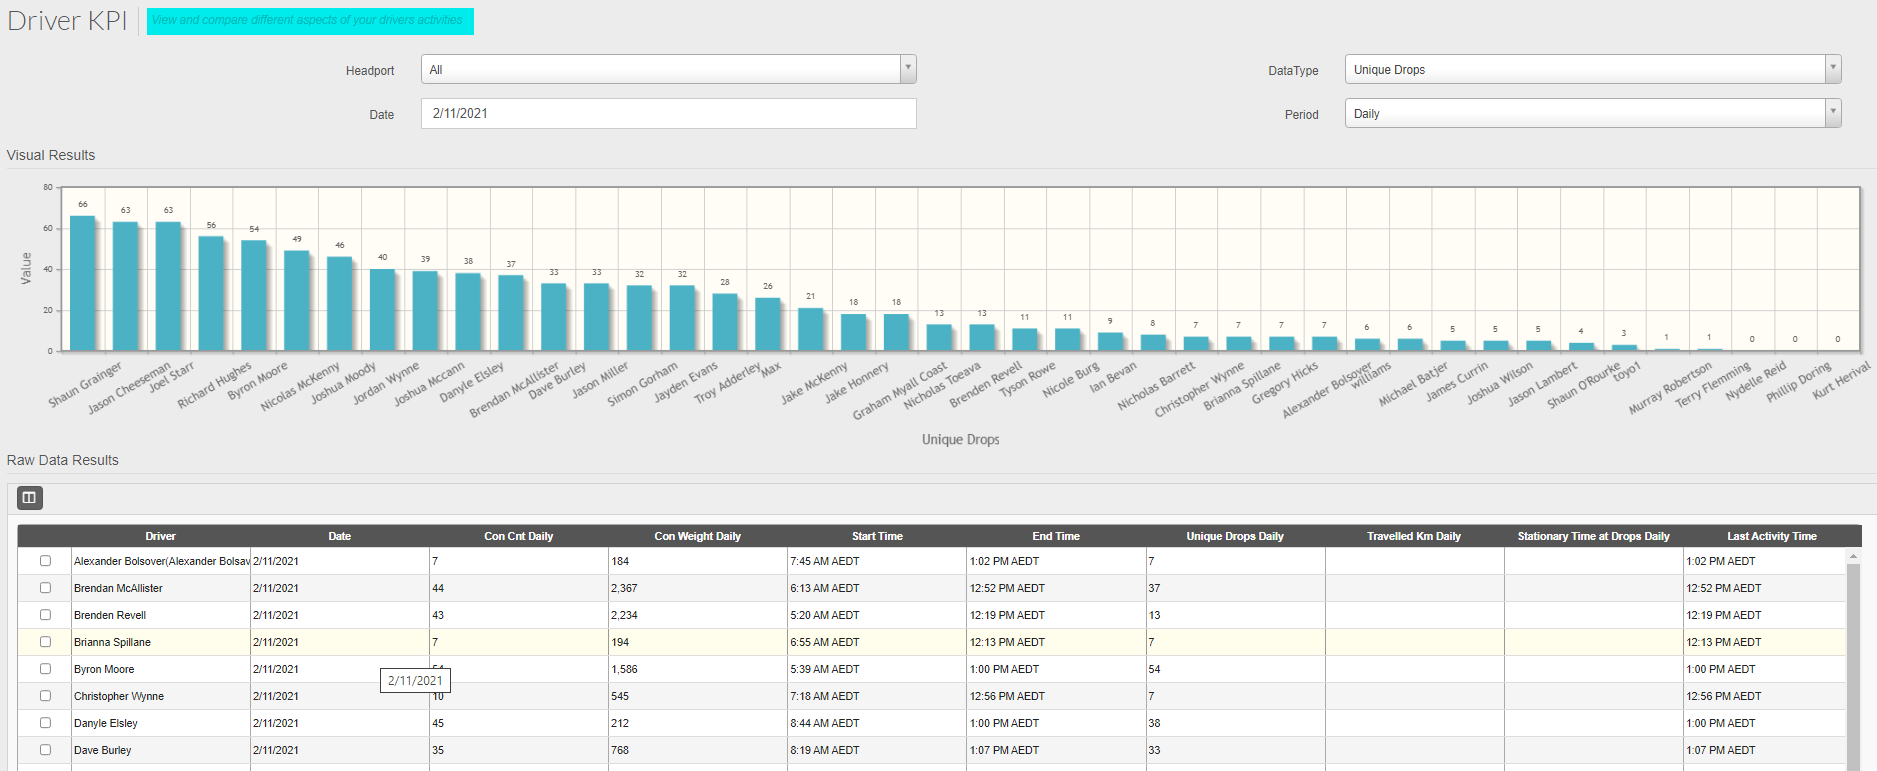
The Headport filter at the top-left can be used to sort for drivers from different Headports. You may want to only see information for drivers from one particular Headport. To do this, you would simply click the drop-down and select the relevant Headport to filter by.
This field requires that your drivers are set against/linked to a headport for accurate information to display. To set a Headport for a driver you simply need to edit their login in the staff list and assign them the appropriate Headport.
The Date field is used to select a specific date you want to look at information for. Selecting today's date will return information for today only. For example, if you were looking at Unique Drops, clicking today's date would show you information for this data type for today only.
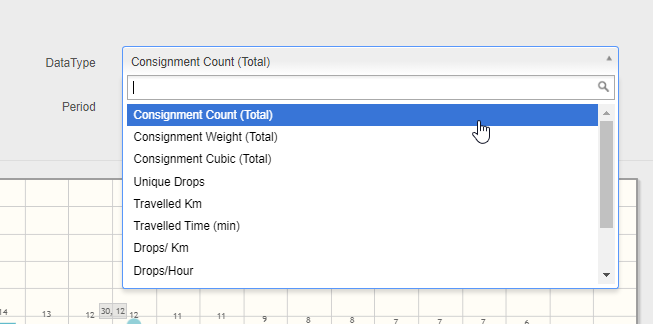
The DataType field is what information you wish to view:
This field requires that your drivers are set against/linked to a headport for accurate information to display. To set a Headport for a driver you simply need to edit their login in the staff list and assign them the appropriate Headport.
The Date field is used to select a specific date you want to look at information for. Selecting today's date will return information for today only. For example, if you were looking at Unique Drops, clicking today's date would show you information for this data type for today only.
The DataType field is what information you wish to view:
Selecting Consignment Count will show you the number of consignments in total that each driver has on for your selected date.
The Period field can also be used to add additional time period filters.
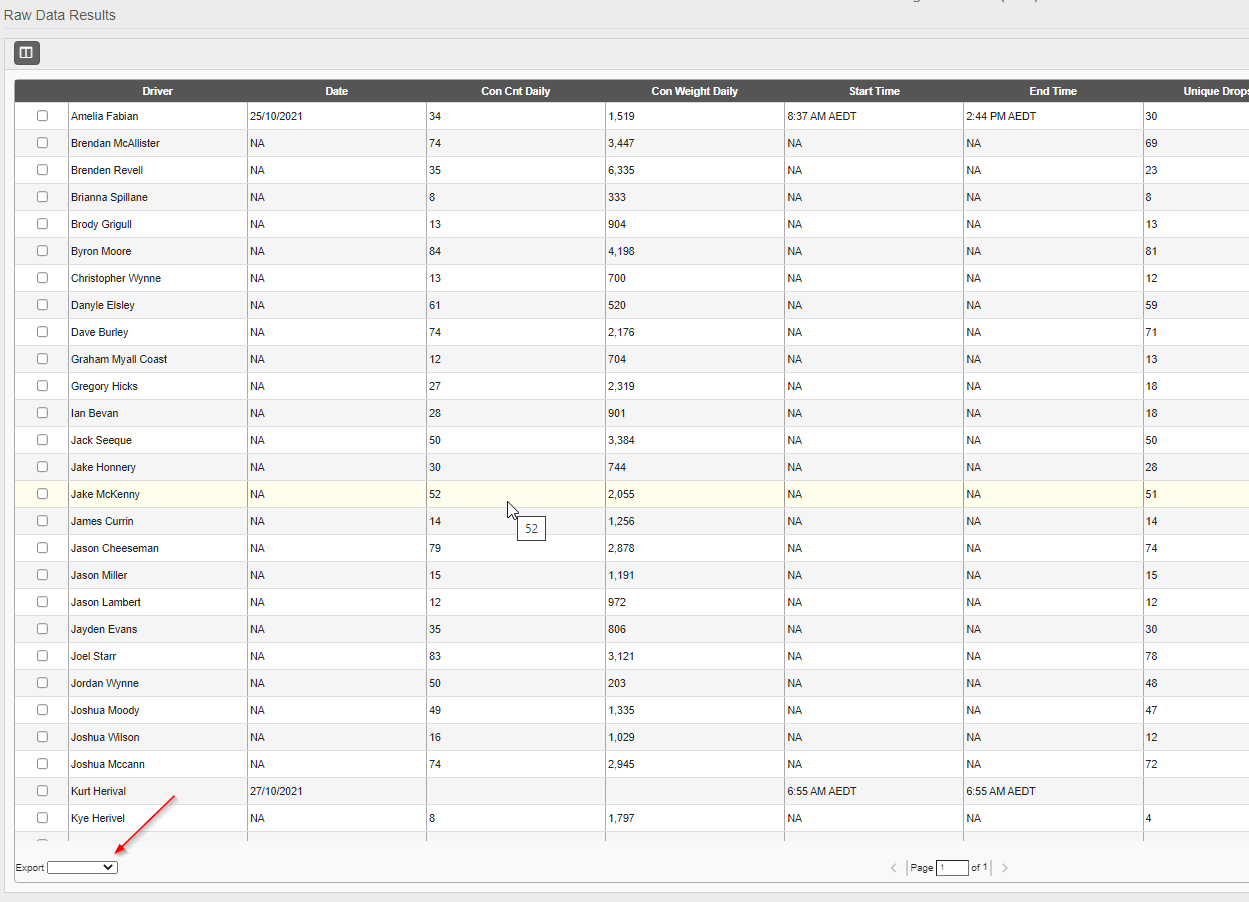
The grid at the bottom of the page can be exported if you need the information in a spreadsheet. This grid gives a detailed breakdown of each driver:
The Period field can also be used to add additional time period filters.
The grid at the bottom of the page can be exported if you need the information in a spreadsheet. This grid gives a detailed breakdown of each driver:
You can also change the columns in the results grid by using the column selector button:
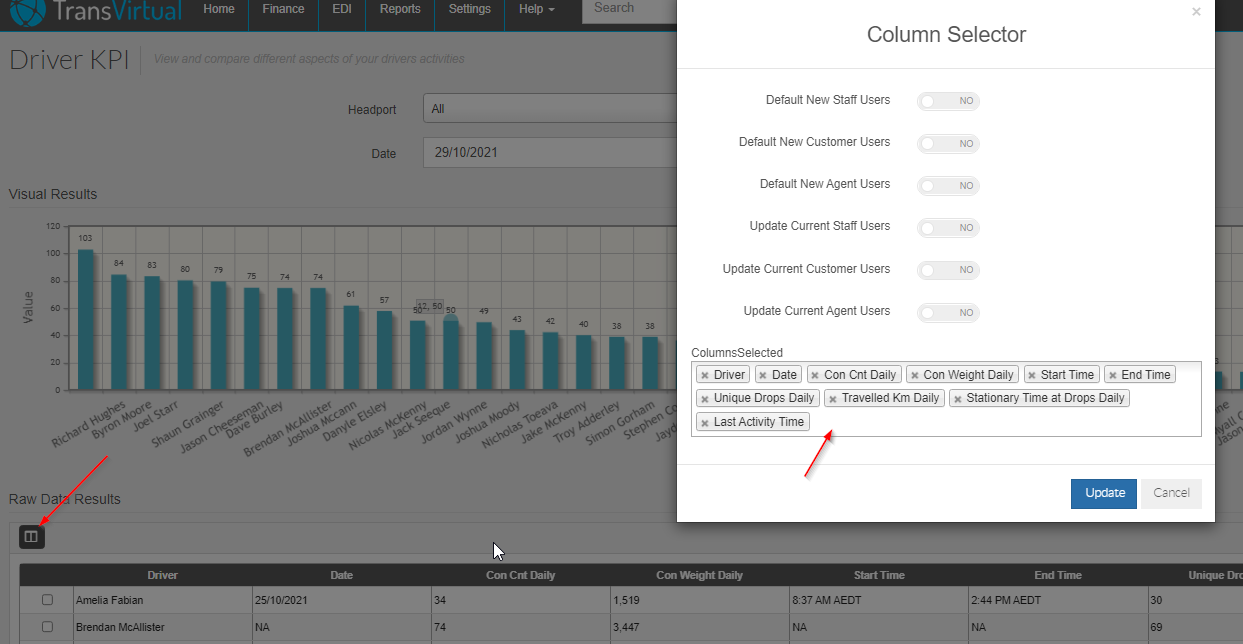
Changing the columns and then updating will make the results grid display in the manner you have made any changes.
Changing the columns and then updating will make the results grid display in the manner you have made any changes.
Scan Data (Item Level), Consignment Data and Finance Data Pages
These 3 pages are all essentially the same in terms of setup - the only real differences between the pages are the actual data being looked at; so scan data looks at scan information, the consignment data page looks at consignment data and the finance data page looks at finance information. The configuration and fields available are much the same - see below for how these pages can be setup and used:
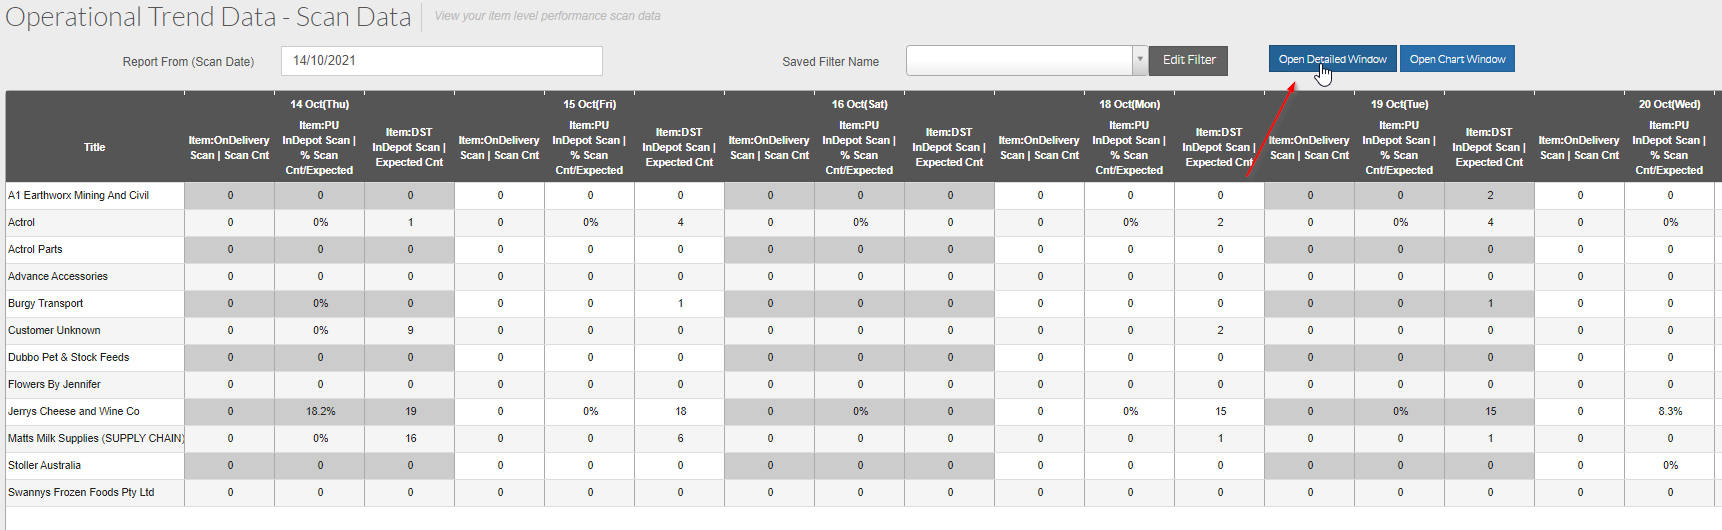
In the above example the results being displayed are Depot scans sorted by customer. Depending on what page you are accessing the results you see will vary.
Clicking the Report From (Scan Date) field top-left will allow you to determine when you want the data to start appearing - change this as you need.
The Saved Filter Name field allows you to create and save search filters that can be quickly accessed each time you visit this page. For example, click the box that says Edit Filter and you will see this:
In the top field, give this filter a name - this example will be called Test, but make sure you make yours something relevant to what the filter is doing, so if your filter is setup to show depot scans for customers you should give it a name that represents this. Regardless of the page you are accessing, the saved search filter should have a name that is unique to what it does so that anyone using it will have an idea of the results they should expect to see.
The Share Saved Filter toggle should be set to yes if you want to make this filter a public one - you may want to create a filter and allow other users access to it, if so, set this to yes to make it publicly visible. Once the filter has been saved you can select it each time you visit this page by clicking it from the drop-down:
The Period can be set to Daily, Weekly, etc. Up to you what is best but daily may be more useful as this page may be something you would access each day. This field is just a way to filter for a specific time/date range.
The Max Periods field is how many results you want to display. This example is set to 14 Daily which means if the report data starts from the 3rd, the last column will be the 17th - 14 periods:
The GroupBy field is used to determine whether you want to display results for customers, zones or users.
If you were after User specific information you would need to select User from the options.
The Data field is what scanning (or consignment/finance - depending on which of the 3 pages you are accessing) information you wish to see returned in the results grid:
The above data would show item level On Delivery Scan counts - number of On Delivery scans.
The Include and Exclude Rules tabs are simply ways of including specific customers, zones or users OR excluding them; depending on where you enter the information (Include vs Exclude). You may want to see data for all users but one - if this is the case you would click on the exclude rules tab and add their name to the users list to be excluded from the results.
The Hide Weekends toggle is a way to exclude weekend days from the results - you may not operate on weekends, hence wouldn't need to see weekends.
This page also gives you the option to get even more detail than what is displayed at first glance. Click on the button that says Open Detailed Window:
Doing this then opens a new window in a new tab. From here back in the original tab, click a cell in the results grid and you will get a more detailed breakdown of that particular cell you have clicked on. For example:
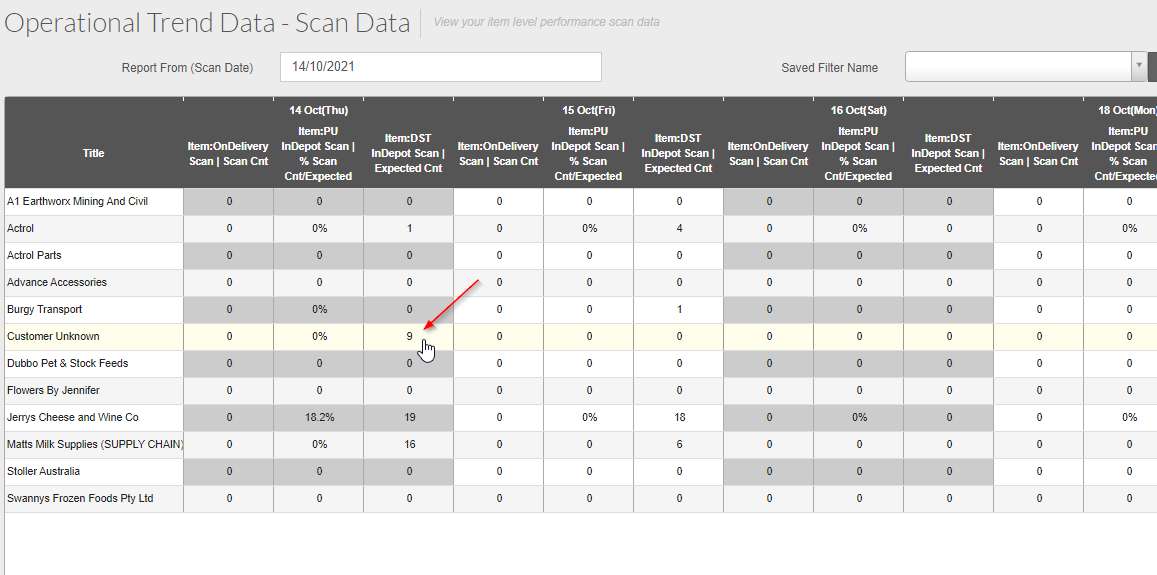
Clicking on the above cell, you then see the information appear on your new tab in more detail:
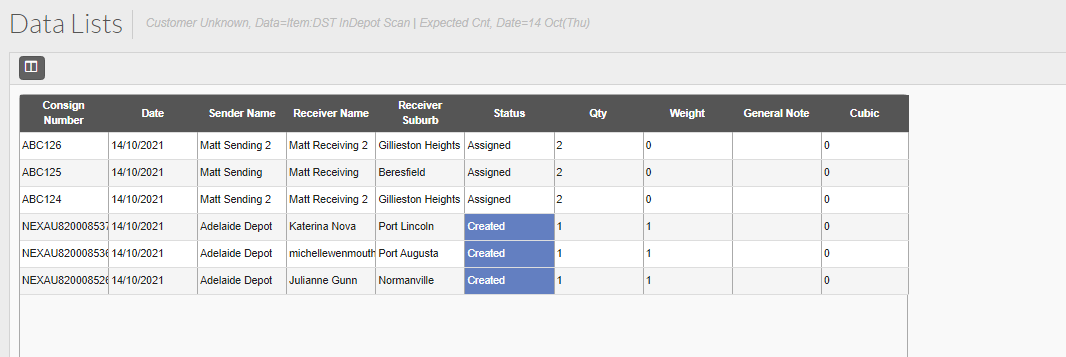
You can see that the detailed window provides a detailed version of the 9 value seen in the original screen.
This button is simply a way to see more information than what is initially displayed - this may come in handy if you need more in depth information.
You can export the results into a csv/excel file using the export button bottom-left of the grid if require - generally speaking, any results grid you come across can be exported which makes acquiring reporting data/information much easier.
Doing this then opens a new window in a new tab. From here back in the original tab, click a cell in the results grid and you will get a more detailed breakdown of that particular cell you have clicked on. For example:
Clicking on the above cell, you then see the information appear on your new tab in more detail:
You can see that the detailed window provides a detailed version of the 9 value seen in the original screen.
This button is simply a way to see more information than what is initially displayed - this may come in handy if you need more in depth information.
You can export the results into a csv/excel file using the export button bottom-left of the grid if require - generally speaking, any results grid you come across can be exported which makes acquiring reporting data/information much easier.